


Bitcoin Analysis
October 8, 2024 | Weekly Update | Eli R. Brown Crypto Research

Welcome back to Eli R. Brown Crypto Research (formerly Lawn Chair Trades)! It’s been nearly a year since our launch. I’ve been busy building a design and marketing agency, www.erbdc.ca, helping traders, prop firms, and fintech companies grow their brands.
I’m excited to revive this newsletter as a free resource. Moving forward, Eli R. Brown Crypto Research will be your go-to source for research and technical analysis on Bitcoin, Ethereum, and Binance Coin. Each week, I’ll provide short, intermediate, and long-term sentiment ratings, along with actionable trade ideas.
Additionally, I’m introducing Eli R. Brown Crypto Signals, which tracks the top 35+ cryptocurrencies. Subscribers receive sentiment ratings, trade entries, stop-loss levels, take-profit targets, and risk management tips.
The value you receive far exceeds the $47/month fee, with daily high-probability trade ideas to help you profit. Sign up now for a risk-free 14-day trial:
NOTE: All of the cryptocurrencies I analyze trade on the Binance Exchange.
Eli R. Brown Crypto Bitcoin Fear and Greed Index

The index is used to gauge market sentiment for Bitcoin, ranging from Extreme Fear to Extreme Greed, with 49 being squarely in the Neutral zone. The index measures how emotional the market is.
Bitcoin Seasonality
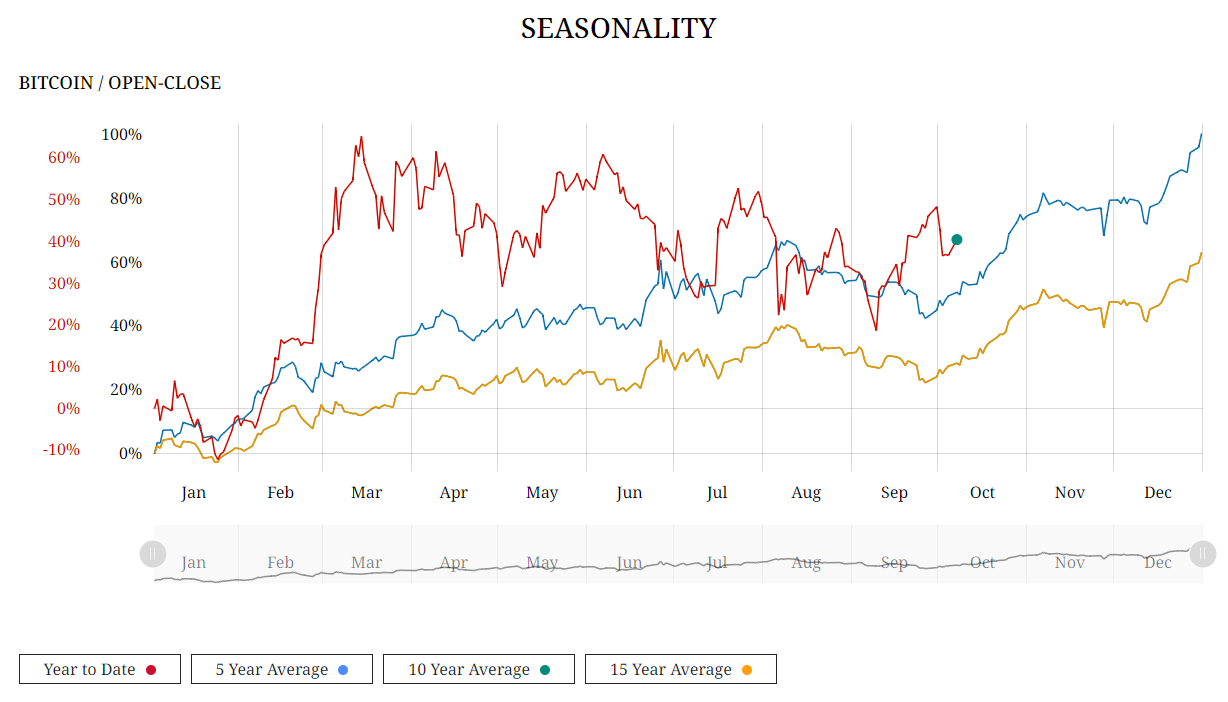
Key Takeaways:
Long-term Trends: The 15-year average shows a much smoother and stable performance, while the 5-year average and YTD data show more aggressive moves. This implies that Bitcoin has become more volatile and has experienced greater spikes in more recent years, potentially due to increased adoption, speculation, and macroeconomic factors.
Current Situation (2024): The YTD data shows Bitcoin facing a rough Q3, with sharp drops in September. The start of October indicates a recovery attempt that aligns with past patterns of stronger performance toward the year-end, especially in November and December.

Q4 Seasonality: Historically, Bitcoin tends to perform well in the fourth quarter, with November and December showing the most growth in both the 5-year and 15-year averages. The YTD trend shows recovery after volatility, suggesting a potential alignment with historical patterns by year-end.
Bitcoin Hashrate

Key Takeaways:
The hashrate represents the total computational power used by miners to validate Bitcoin transactions and secure the network.
Since 2010, the hashrate has shown a consistent upward trend, with notable accelerations from 2018 onwards. This steady growth indicates increasing miner activity and more competition among miners as Bitcoin gains popularity and adoption.
Despite fluctuations in Bitcoin’s price, the hashrate’s long-term growth trend continues, with recent levels exceeding 700 million terahashes per second (TH/s). This suggests robust security and confidence in the Bitcoin network, as more computational power is being dedicated to its maintenance.
Bitcoin Miner to Exchange Flow

Key Takeaways:
The chart shows varying amounts of Bitcoin being transferred from miners to exchanges. When miners send more Bitcoin to exchanges, it usually suggests they might be looking to sell, potentially increasing selling pressure.
There are noticeable spikes in miner flows in several periods, such as July 2023, January 2024, March 2024, and August 2024. These spikes often align with moments of Bitcoin price volatility or significant market events.
Significant spikes in miner transfers to exchanges often precede or coincide with price corrections, suggesting that miners may have anticipated market conditions by selling.
The increase in miner flow in August 2024, followed by price stabilization around $62k, could potentially indicate that miner selling pressure has stabilized.
Bitcoin Average Mining Costs

Key Takeaways:
Bitcoin mining is currently unprofitable for many miners, with average mining costs surpassing Bitcoin's market price. As of October 7, 2024, the average mining cost stands at $72,694, while the Bitcoin price is lower at $62,190, yielding a mining cost-to-price ratio of 1.17. This may force some miners to either sell more of their Bitcoin reserves or halt operations, which could, in turn, affect the network’s hashrate.
Over time, changes in market conditions, Bitcoin's price, or mining technology may help improve this ratio. For now, miners are likely feeling increased financial pressure.
Bitcoin Net Unrealized Profit/Loss

Key Takeaways:
NUPL is a metric used to gauge the sentiment and potential market phase based on whether Bitcoin holders are in a state of profit or loss. The NUPL indicator ranges from -100% to 100%, showing the difference between unrealized profits and losses across all holders.
As of the latest data in 2024, NUPL appears to be in the Optimism/Anxiety range, suggesting the market is still positive, but there is some anxiety and hesitation among participants.
Bitcoin’s price has stabilized around higher levels, indicating that while many holders are in profit, the market is not yet in the extreme Euphoria/Greed phase.
Weekly Chart
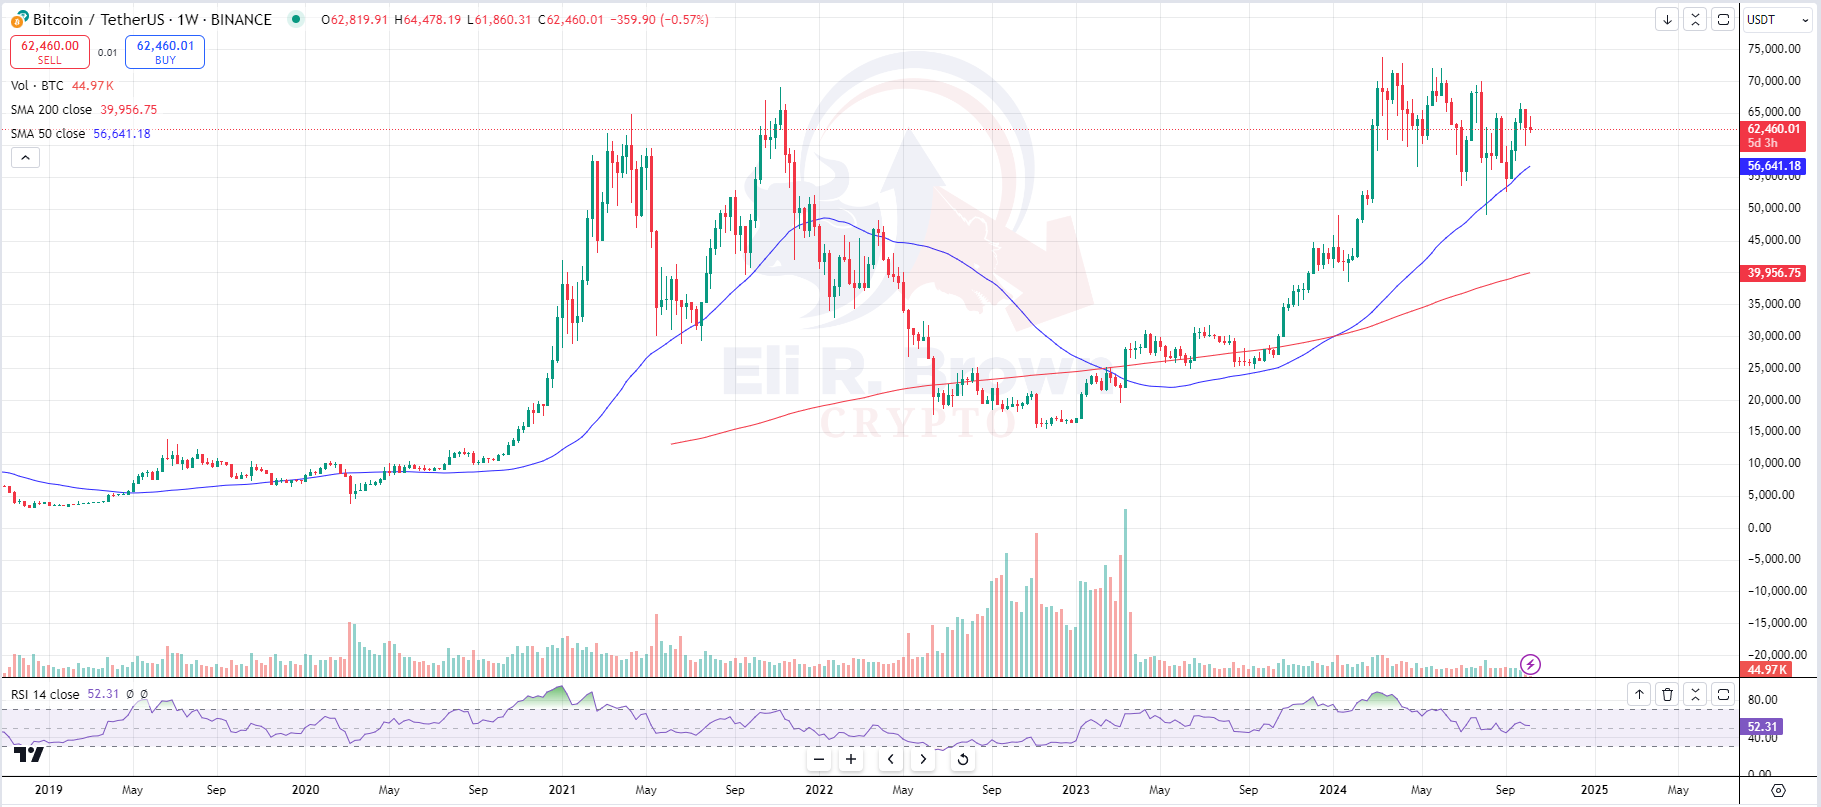
When we zoom out BTC looks like it’s forming a flagging pattern. When these patterns form in crypto they usually attempt a trap. I think it’s possible we see BTC whipsaw to new highs then straight back down to $50k before resuming a healthy bull rally.
Weekly Chart

BTC is currently in a no trade zone between two major Anchored VWAPS from the 2024 high and when price broke-out back in October of 2023.
Daily Chart

Trend resistance overhead at $69K and support below at $60k.
The line in the sand is the red horizontal line sitting at $64,386. We need sustained higher lows over this level to get long.
Daily Chart

Interestingly, the anchored VWAP from when price pulled back to the 200 Day SMA on March 10, 2023 is sitting in alignment with the higher low trendline from the lows in January and September of 2023. If price breaks below its current trend this zone could serve as a price magnet and would produce a bounce trade for us.
Daily Chart
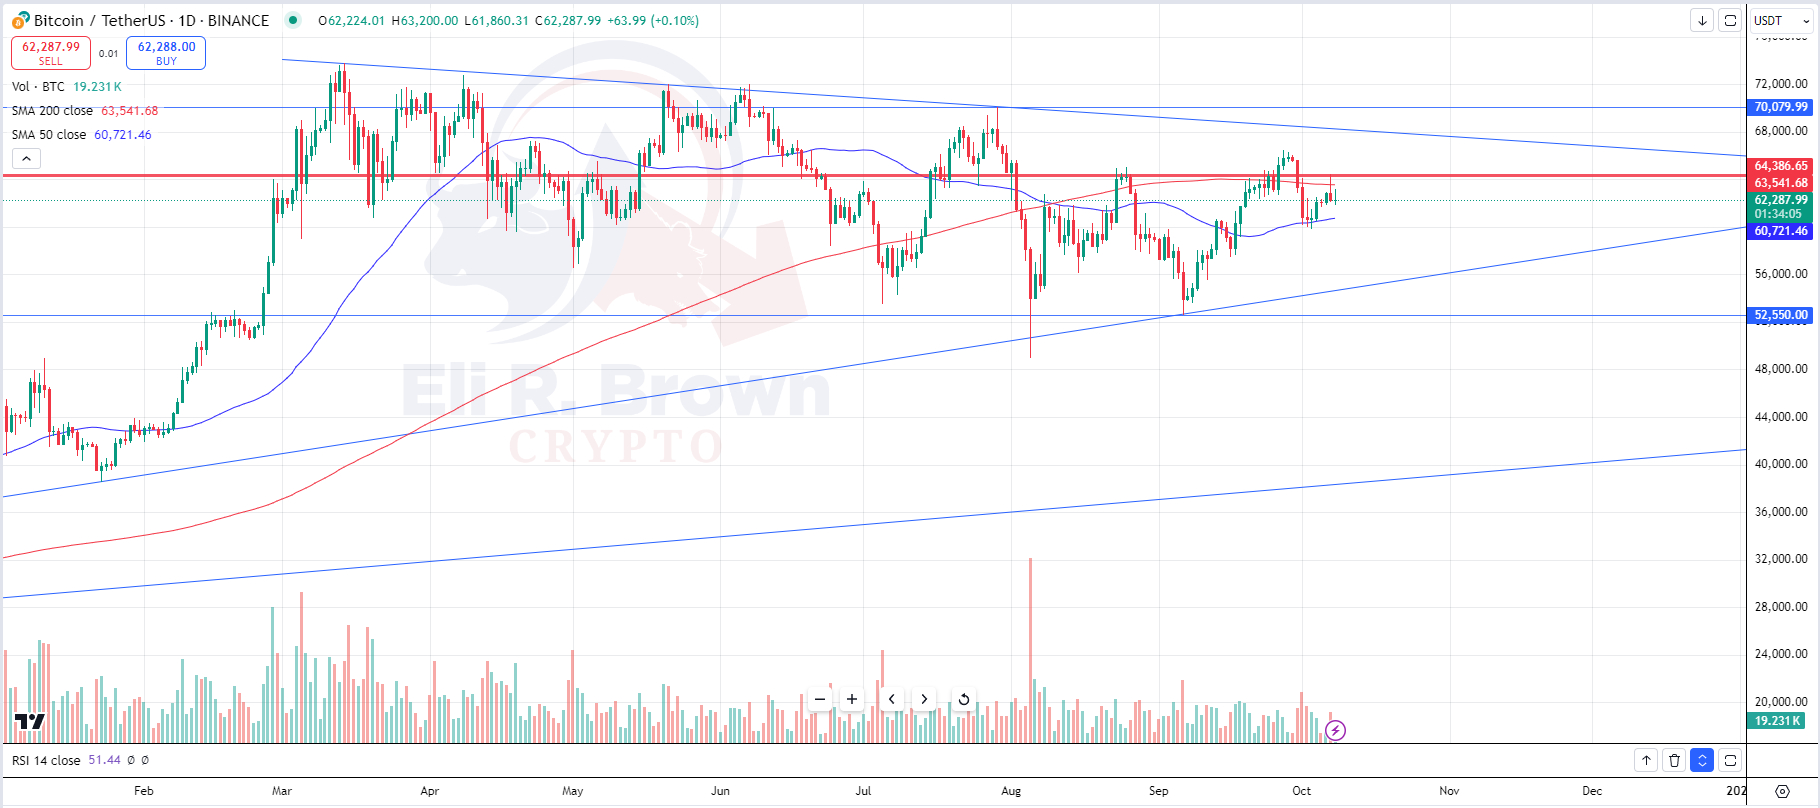
The line in the sand is the red horizontal line sitting at $64,386. If BTC begins to put in higher lows above this line I will flip bullish. While BTC is below this line except it’s still holding its higher lows and trend I will remain neutral. If BTC begins testing the blue horizontal line at $52,550 and begins to put in lower highs I’ll flip bearish.
Sentiment Rating

Thank you for reading! If you have any questions, comments, or feedback leave a comment below.
Nothing written, expressed, or implied here should be looked at as investment advice or an admonition to buy, sell, or trade any security or financial instrument. As always, do your own diligence.