


Arkham (ARKMUSDT) Analysis
Arkham (ARKMUSDT): A Technical Breakdown and Price Forecast | February 3, 2025

Level up your crypto trading with 35 years of combined market expertise. Eli R. Brown Crypto Research now features veteran market analyst Bruce Powers (CMT). Expect weekly trade signals (entries, stops, targets) for top crypto pairs and trending coins. Plus, get ready for Discord access, algorithmic strategies, and video calls.
Please note that all cryptocurrency charts use the Binance price feed for consistency, unless otherwise specified.
This information is for educational purposes only. Nothing written, expressed, or implied here should be looked at as investment advice or an admonition to buy, sell, or trade any security or financial instrument. As always, do your own diligence.
Yesterday presented an excellent dip-buy opportunity across many coins. Instead of getting caught up in sensational headlines and exaggerated tweets like “$2 billion just vanished from the crypto market,” focus on the underlying price action. That kind of fear-mongering adds no value to your strategy. Always ask yourself, “How does this information help me make money?” More often than not, it doesn’t. Instead, focus on price action and position yourself where risk can be effectively managed - typically around previous higher lows. This is where the real profit potential in crypto lies. Also, ensure you're trading a timeframe that matches the volatility; yesterday, I had to operate on the 1-minute chart.
Arkham (ARKMUSDT) Analysis
Weekly Chart

Price bounces perfectly off of the resistance (now support) breakout zone from back in Feb, 2024.
We’re below all AVWAPS from inception ($1.273), ATH ($1.896), previous higher low from Aug, 2024 ($1.605), and previous lower high around $2.50 from Dec, 2024 ($1.537). 50-Week SMA sits at $1.793.
It will take some strong buying pressure to break these levels, however, I do see a potential short-term bounce trade in the works.
Daily Chart
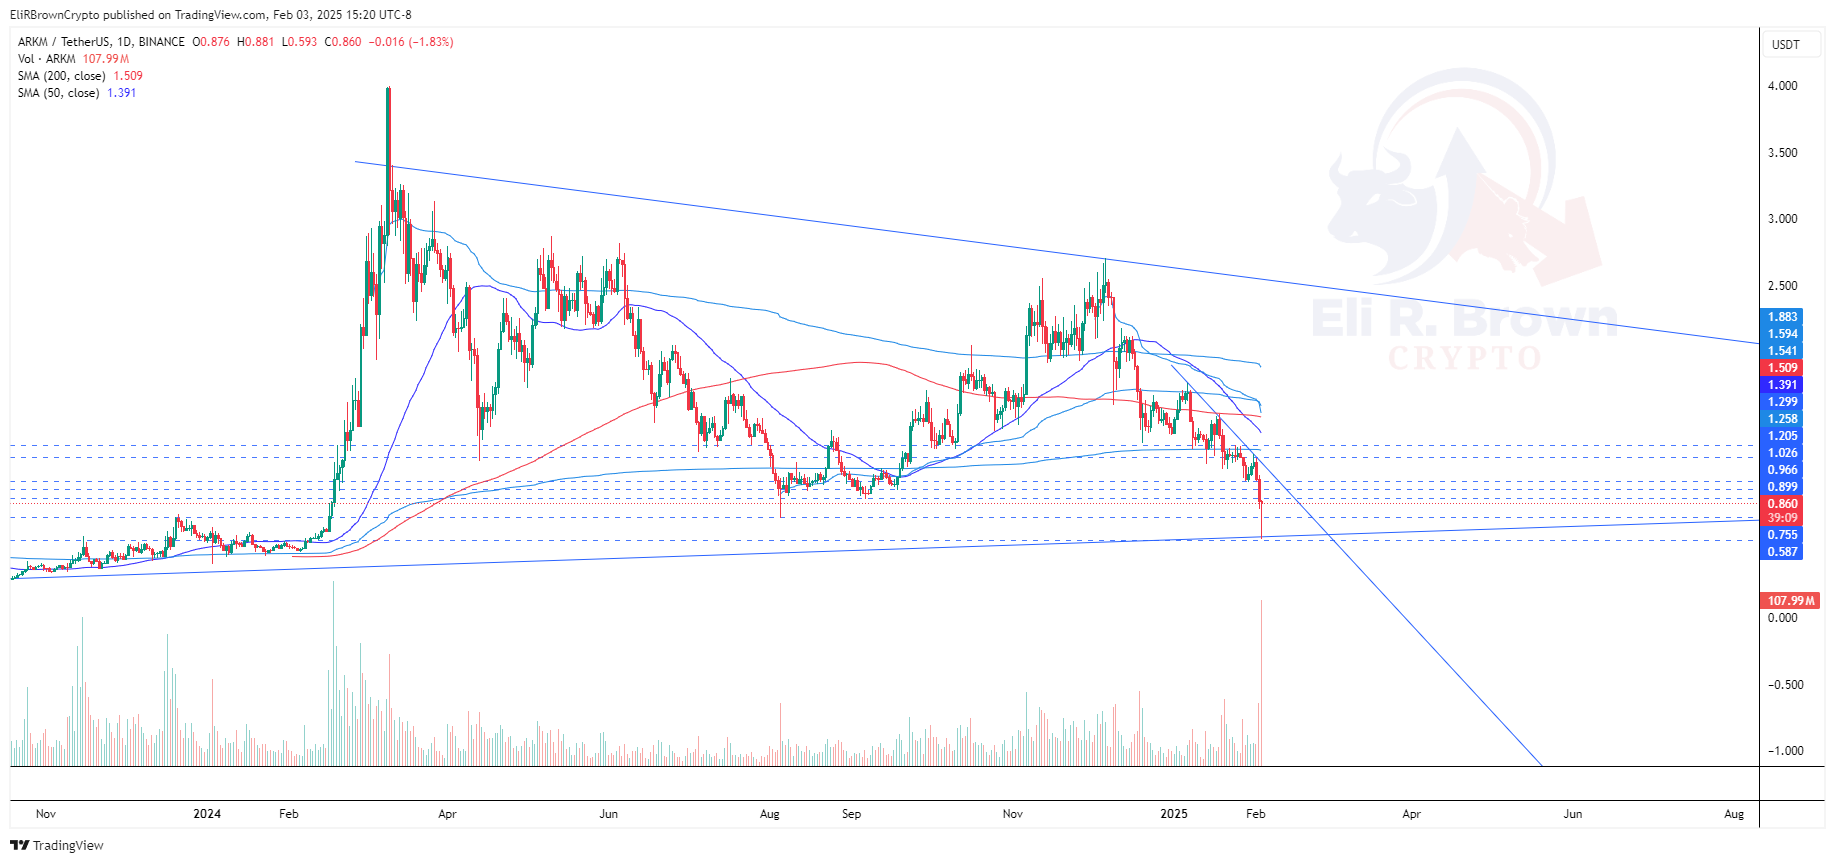
200-Day SMA sits at $1.509 and 50-Day SMA sits at $1.391. We have a short term trendline drawn connecting the previous lower highs from the price breakdown over the past few weeks. Price will need to clear this resistance level aligning with our horizontal resistance lines at $0.899, $0.966, and $1.026 in order for us to get more aggressive into a long position. Until then we are trading this with VERY small size.
Daily Chart - RSI Analysis

Another look at the daily chart with the simple moving averages (SMAs) removed and the Relative Strength Index (RSI) added onto the bottom of the chart.
As you can see, price is experiencing bullish convergence with the price falling lower than it’s higher low from Aug, 2024 but the RSI is showing more strength. This provides bullish validation for a dip buy trade as it also aligns perfectly with our trendline and the initial breakout zone from back in Feb, 2024.
4-Hour Chart

Zooming into the 4-Hour Chart you can see we’re currently in a no-trade zone between support and resistance levels.
We want price to fall towards $0.719 so we can risk off of this level.
1-Hour Chart - Trade Idea #1 - LONG

Zooming in further, we can see on the 1-hour chart a potential trendline support zone that connects the previous higher lows from the bounce it made last night. I think we have another leg up in the bounce. We’re looking to front-run the Golden Pocket Fib ($0.988 - $1.008) as a potential short-term target as well as the 78.6% Fib at $1.094. Our entry zone is between $0.846 - $0.774. Our full-stop is at $0.7149 below the previous higher low. Hitting this level would invalidate this short-term bounce trade idea and we would likely retest the lower trendline around $0.60 before resuming the bounce.
If this happens, watch for price to print a higher low ABOVE $0.713, even if it’s just $0.001, that is a long trade I would take as risk is managed well with a stop at $0.712 and a large potential upside.
Sentiment Rating & Signals
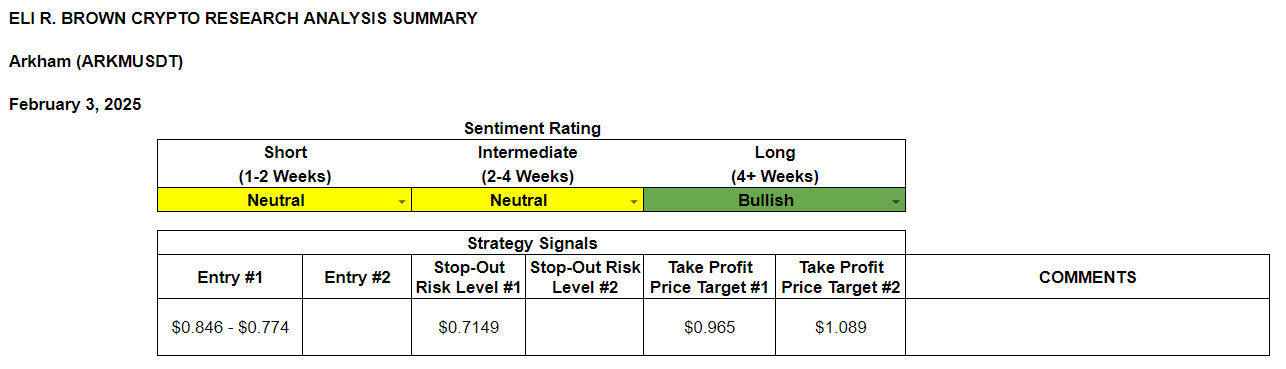
Long Trade Idea #1: Arkham (ARKMUSDT)
Entry Zone: $0.846−$0.774
Average Entry Price: $0.81 (Midpoint of entry range)
Stop Loss Level:
Full Stop: $0.7149
Take-Profit Targets:
Take-Profit Target 1 (TP1): $0.965
Reward: $0.155 (TP1 - Average Entry)
R:R: 1.63
Take-Profit Target 2 (TP2): $1.089
Reward: $0.279 (TP2 - Average Entry)
R:R: 2.93
Thank you for reading! If you have any questions, comments, or feedback leave a comment below.
This information is for educational purposes only. Nothing written, expressed, or implied here should be looked at as investment advice or an admonition to buy, sell, or trade any security or financial instrument. As always, do your own diligence.