Bitcoin (BTCUSDT) Analysis
Bitcoin (BTCUSDT): A Technical Breakdown and Price Forecast | February 9, 2025
Level up your crypto trading with 35 years of combined market expertise. Eli R. Brown Crypto Research now features veteran market analyst Bruce Powers (CMT). Expect weekly trade signals (entries, stops, targets) for top crypto pairs and trending coins. Plus, get ready for Discord access, algorithmic strategies, and video calls.
Please note that all cryptocurrency charts use the Binance price feed for consistency, unless otherwise specified.
This information is for educational purposes only. Nothing written, expressed, or implied here should be looked at as investment advice or an admonition to buy, sell, or trade any security or financial instrument. As always, do your own diligence.
BTCUSDT Market Sentiment
The Eli R. Brown Bitcoin Fear & Greed Index is at 46 giving us a FEAR classification. What does this mean? It means be very afraid. But seriously, it means investors are cautious at these levels. As you can see from yesterday (44), last week (60), and last month (50), we have generally been in the neutral to a little bit greedy to a little bit fearful. This could lead one to believe investors are becoming more comfortable at these price levels. When examining Bitcoin you have to take into account its range. It’s not like other assets, therefore it does not trade like other assets. Price ranges of $15k-$20k are normal at these levels for Bitcoin.
The headline the other day of $2 billion being removed from the market is kind of funny when you look at this. How was this any different from July/Aug 2024? People have short memories. The news wants you to believe it’s worse than it is. However, it’s actually pretty normal for Bitcoin to pullback hard, puke out the weak hands, then remount its trend, and continue upwards again.
Bitcoin (BTCUSDT) Analysis
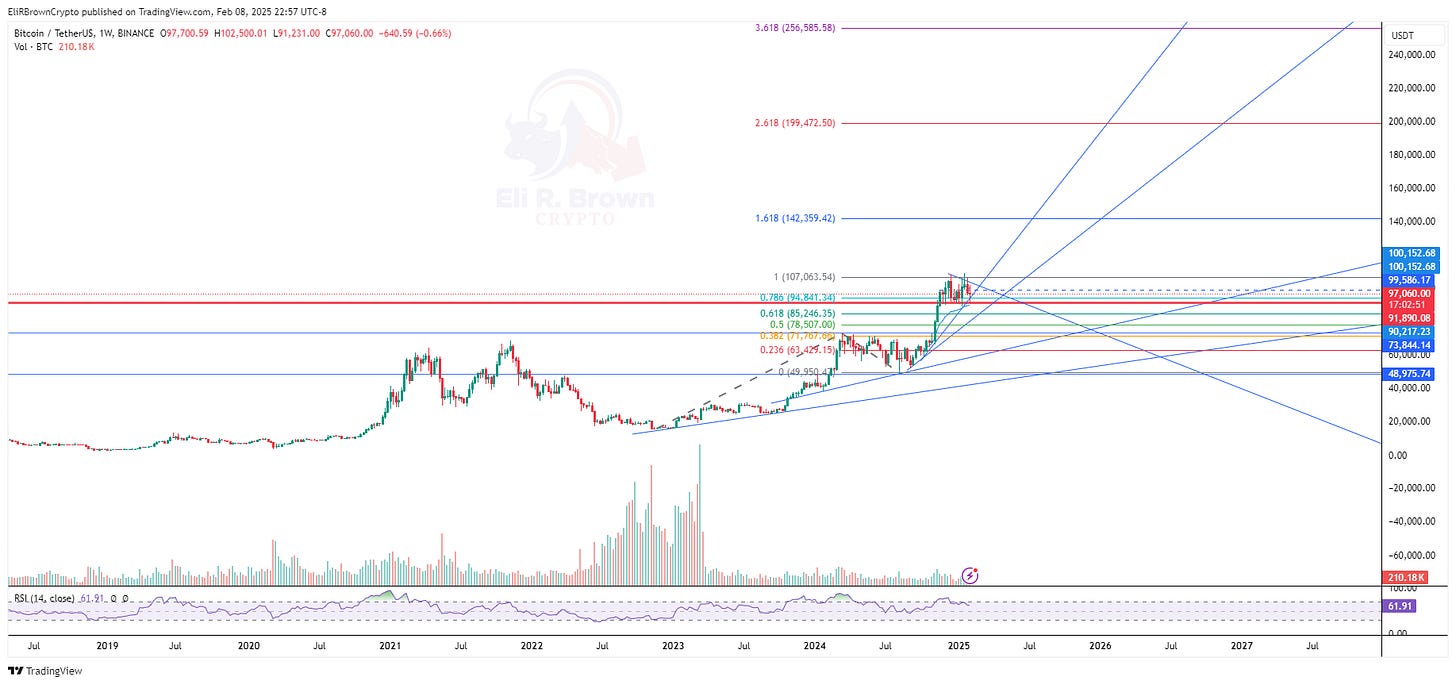
Weekly Chart
I believe we're in Wave 4 of a five-wave impulse pattern. Wave 5 could extend toward the 1.618, and potentially the 2.618 or even 3.618, trend-based Fibonacci extensions. While a pullback towards $80,000 remains possible, current price action and overall market sentiment suggest further upside.
However, make the trade your own. Do not risk more than you’re comfortable losing and expect to lose on all of your trades.
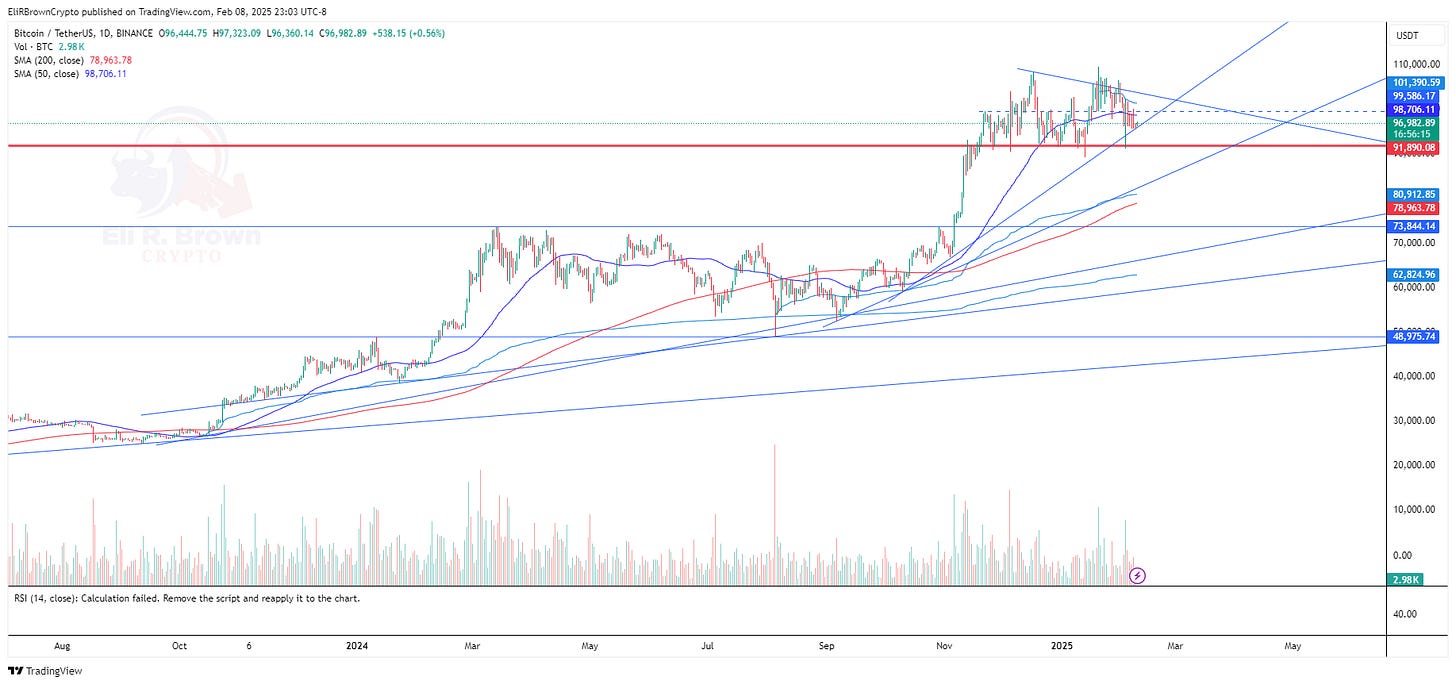
Daily Chart
For what trend lines are worth, price seems to be holding its original breakout structure trendline. If major $92k support decides to break next stop is likely $80k where the 200-day SMA and AVWAP from the higher low of this breakout almost intersect at $78k and $80k.
4-Hour Chart
There is a good chance we remain within these trendlines for the remainder of February. Price needs to build over $97,407 (zoom-in) and then get through and build over $100,151 and $101,330 as the next major levels. Next stop is the upper thick trendline in the $105k zone.
It’s important to not add any size to your position until these levels are cleared and previous resistance turned support has proven itself to hold on a pullback.
REMINDER - TRADE IDEA #2 FROM JANUARY 18, 2025 - LONG
Sentiment Rating & Signals
Trade Idea #1 (from January 18, 2025 article you can read by clicking HERE:
Entry Range: $93,500 - $91,800
Average Entry Price: $92,650
Stop Loss: $88,498
Take-Profit Target 1: $108,000
Risk (to Stop Loss): $4,152
Reward (to Take Profit 1): $15,350
Risk-Reward Ratio (R:R): 3.70
Take-Profit Target 2: $127,500
Risk (to Stop Loss): $4,152
Reward (to Take Profit 2): $34,850
Risk-Reward Ratio (R:R): 8.39
TRADE IDEA #2 - 1-Hour Chart - LONG
Trade Idea #2:
Entry Range: $95,300 - $96,100
Average Entry Price: $95,700
Stop Loss: $88,498
Take-Profit Target 1: $108,000
Risk (to Stop Loss): $7,202
Reward (to Take Profit 1): $12,300
Risk-Reward Ratio (R:R): 1.71
Take-Profit Target 2: $127,500
Risk (to Stop Loss): $7,202
Reward (to Take Profit 2): $31,800
Risk-Reward Ratio (R:R): 4.42
TRADE IDEA #3 - 1-Hour Chart - LONG
Trade Idea #3:
Entry Range: $97,300 - $100,155
Average Entry Price: $98,727.50
Stop Loss: $94,128.00
Take-Profit Target 1: $108,000
Risk (to Stop Loss): $4,599.50
Reward (to Take Profit 1): $9,272.50
Risk-Reward Ratio (R:R): ≈2.02
Take-Profit Target 2: $127,500
Risk (to Stop Loss): $4,599.50
Reward (to Take Profit 2): $28,772.50
Risk-Reward Ratio (R:R): ≈6.26
Thank you for reading! If you have any questions, comments, or feedback leave a comment below.
This information is for educational purposes only. Nothing written, expressed, or implied here should be looked at as investment advice or an admonition to buy, sell, or trade any security or financial instrument. As always, do your own diligence.


