Chainlink (LINKUSDT) Analysis
Chainlink (LINKUSDT): A Technical Breakdown and Price Analysis | January 30, 2025
Level up your crypto trading with 35 years of combined market expertise. Eli R. Brown Crypto Research now features veteran market analyst Bruce Powers (CMT). Expect weekly trade signals (entries, stops, targets) for top crypto pairs and trending coins. Plus, get ready for Discord access, algorithmic strategies, and video calls.
Eli R. Brown Crypto Research is a reader-supported publication. To receive new posts and support my work, consider becoming a free or paid subscriber.
Please note that all cryptocurrency charts use the Binance price feed for consistency, unless otherwise specified.
This information is for educational purposes only. Nothing written, expressed, or implied here should be looked at as investment advice or an admonition to buy, sell, or trade any security or financial instrument. As always, do your own diligence.
Chainlink (LINKUSDT) Analysis - Bull Wedge Breakout
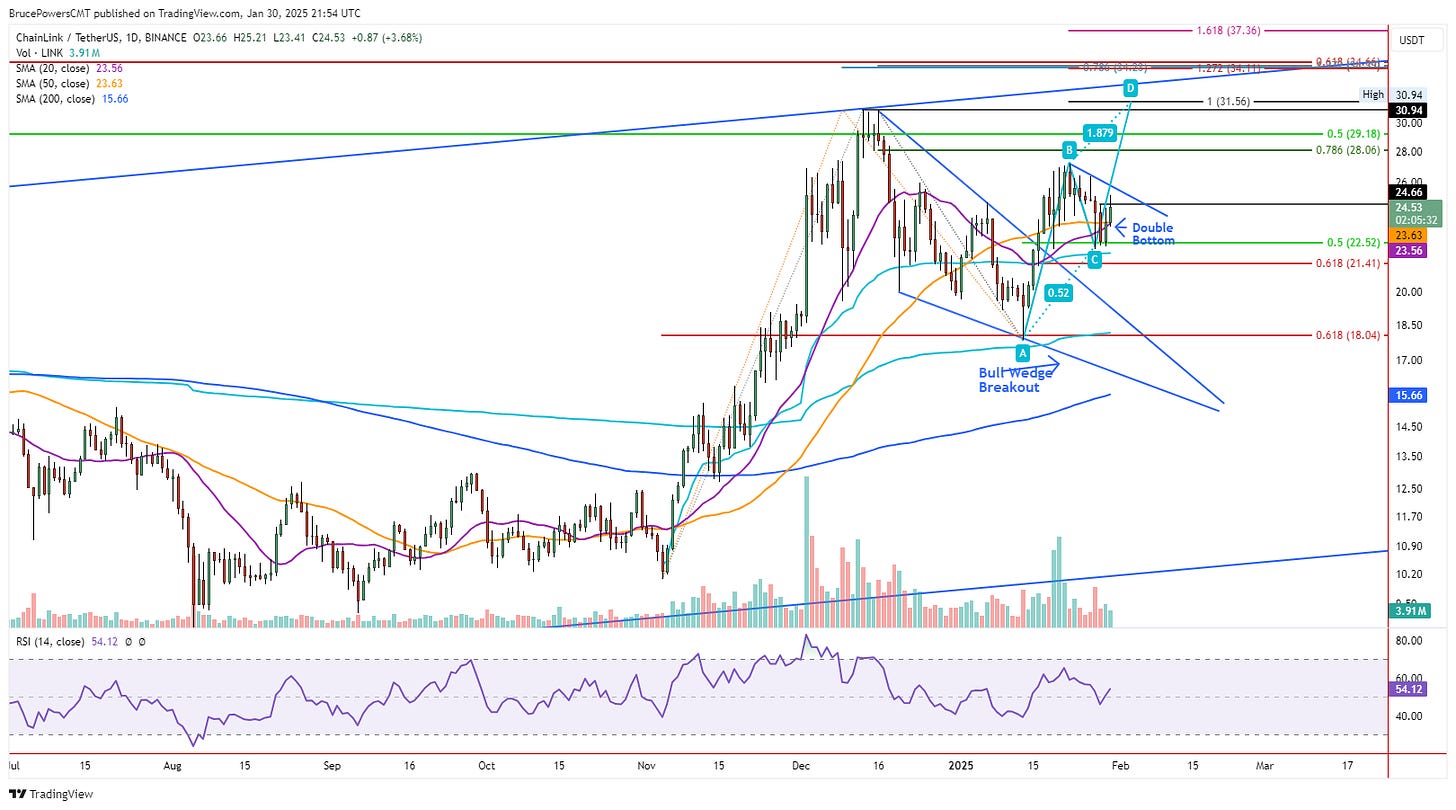
A bull trend continuation signal triggered recently with a breakout of a falling bull wedge pattern. Anticipating a long entry on a minor pullback that followed the wedge breakout in order to be positioned for a continuation of the bull trend. A strong rally prior to the wedge retracement may have provided a preview of coming attractions.
Weekly Chart
Observations - Weekly
Bull trend of higher highs and higher lows formed a parallel rising channel.
Recent swing high at $30.95 verified the top trend channel line thereby further validating the trend price structure.
Following the $30.95 high, LINK/USDT formed a bullish wedge trend continuation pattern. The low of the wedge retracement found support around an AVWAP (light blue) level set to the March 2024 interim swing high, and the 20-week MA (purple).
A bull wedge breakout triggered two weeks ago and it was followed by a pullback and test of support around the 50% retracement.
Daily Chart
Observations - Daily
As with the weekly chart, the daily chart also shows AVWAP support at the low of the wedge and at the low of the pullback following initial bull breakout two weeks ago indicating that it may be complete and the potential of the bull wedge can be recognized.
Drop below this week’s low of $22.18 and the AVWAP level around $22.00 would show a failure of short-term support and likely lead to a deeper pullback.
A bullish daily reversal triggered today with a rally above Wednesday’s high following a successful test of support at both the 20-day and 50-day MA’s that are near the week’s low.
Further, notice that the 20-day MA is in the process of crossing above the 50-day line, which will further indicate short-term strength following the pullback low of $22.18 from this week.
4-Hour Chart - Trade Idea - LONG
Situation Analysis
Potential bull follow through from the bull wedge breakout two weeks ago following first pullback.
4-hour chart shows a double bottom around support of the 50% retracement and 200-period MA.
Double bottom breakout triggered on Thursday with a rally above the pattern neckline at $24.66. Strength was also confirmed by a reclaim of the 50-period MA ($24.59) at the same time.
Trade Strategy (make it your own)
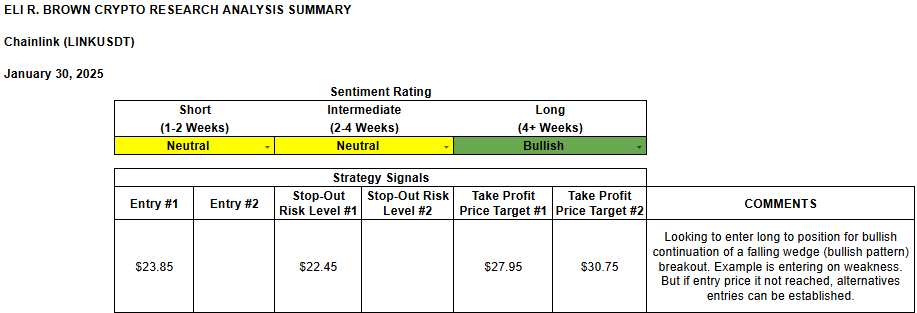
Enter on pullback to price zone around 20-period MA ($23.81) and the Jan. 25 daily high ($23.78).
Entry Zone: $23.95 area, slightly above the price zone as it now.
Alternatively, if pullback doesn’t reach entry zone, watch for a second entry setup to engage the potential of the bull wedge pattern.
Stop Loss Level:
Full Stop: $22.45 (below 200-period MA)
Take-Profit Targets:
Take-Profit Target 1 (TP1): $27.95
Reward: $4.10
R:R: 2.9
Take-Profit Target 2 (TP2): $30.75
Reward: $6.90
R:R: 4.9
Sentiment Rating & Signals
Thank you for reading! If you have any questions, comments, or feedback leave a comment below.
This information is for educational purposes only. Nothing written, expressed, or implied here should be looked at as investment advice or an admonition to buy, sell, or trade any security or financial instrument. As always, do your own diligence.


