


Ethereum Analysis
November 3, 2024 | Monthly Update | Eli R. Brown Crypto Research

Providing a technical update on Ethereum - not too much has changed since our October analysis.
Read our Bitcoin Analysis we published last night:
Sign up for a risk-free 14-day trial to Eli R. Brown Crypto Signals:
NOTE: All of the cryptocurrencies I analyze trade on the Binance Exchange.
Weekly Chart

Resistance at $2,808.66: This level has historically acted as a significant point of rejection, and ETH is struggling to break above this. It aligns with the previous failed breakouts and the 50-week SMA. If we can break above this level and put in sustained higher lows I will flip bullish.
Support at $2,369.92 and $2,111.00: The horizontal support at $2,369.92 aligns with the 200-week SMA, reinforcing a strong support zone. Additionally, $2,111.00 is a stronger lower-level support aligning with our previous higher lows and the trend from the beginning of 2023.
The volume has remained relatively stable but low. Lower volume around these key levels implies indecision and potential for a larger breakout or breakdown once volume returns.
Daily Chart
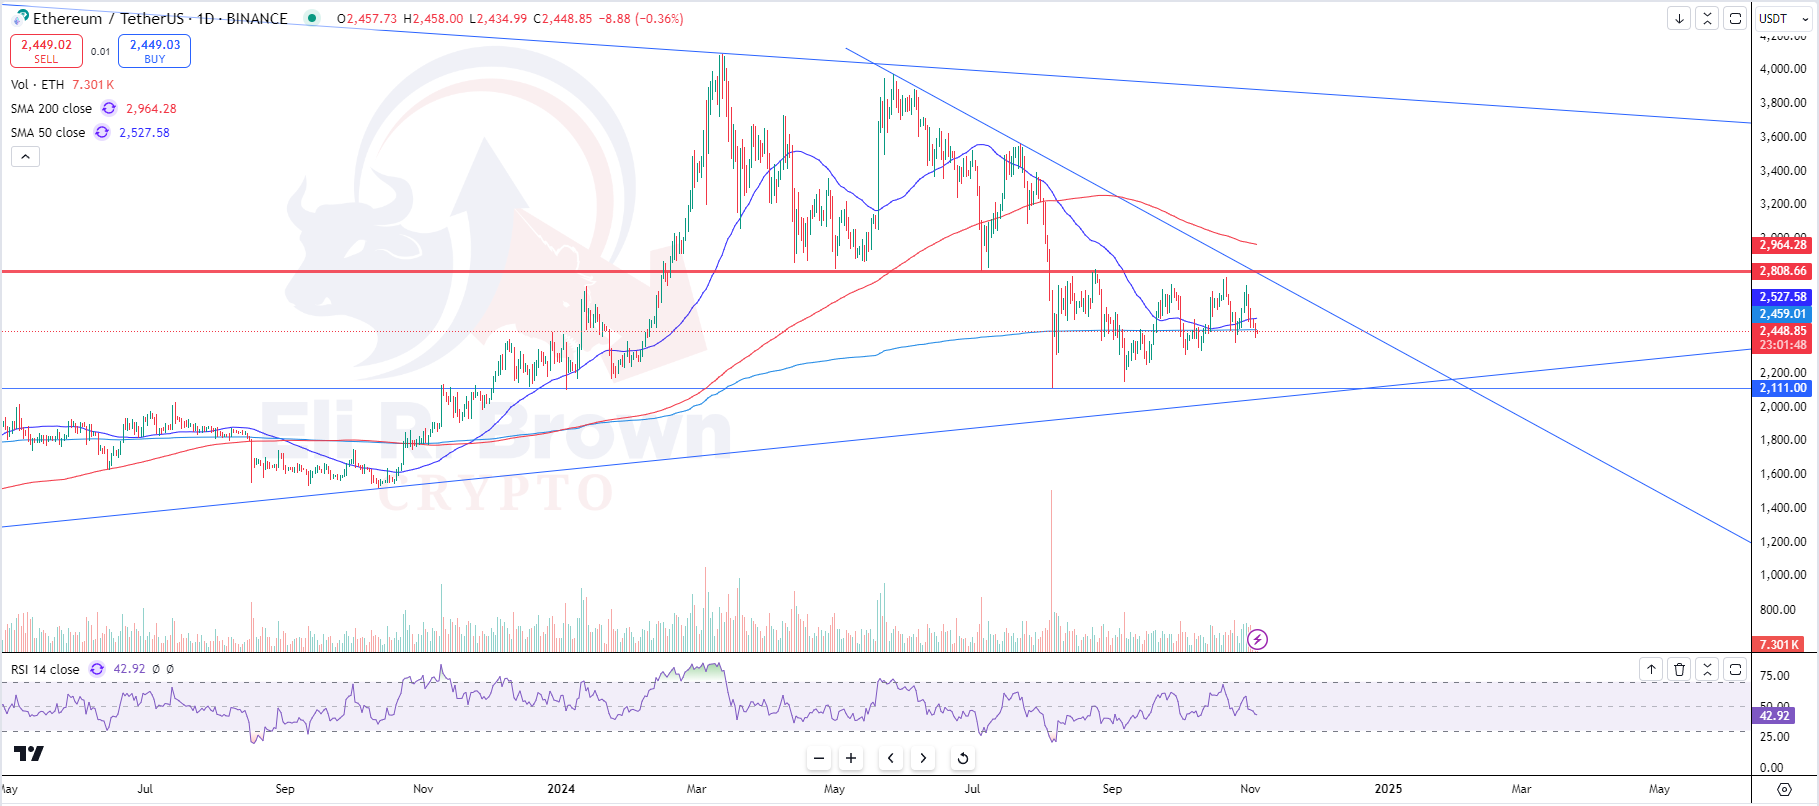
Notice how price is continuing to put in sustained higher lows along with a new high at the end of October when Bitcoin rallied towards its ATH? This is a positive sign.
The price is fluctuating close to $2,527.58, which aligns with the 50-day SMA, indicating a short-term pivot. Breaking above it would be a positive signal, however there is still significant overhead resistance to consider mainly $2,808.66.
Volume spikes are seen during larger moves, suggesting that traders are waiting for confirmation of a breakout or breakdown before committing fully. This confirms indecision and implies that a large move could be coming.
3-Hour Chart

$2382.59 is the previous higher low we need to stay above along with the 200-Week SMA sitting at $2369.92. If we break below this level we’ll likely fall towards $2249.67 which is the trendline closes to the current price and if this fails to hold we’ll likely test support at $2111.00.
A break above $2808.06 and we flip bullish looking for an entry on the first higher low above this level.
Watch for any significant volume increases that coincide with breaks above resistance or below key support—this will signal strong commitment from either bulls or bears.
Pay close attention to the RSI, especially if it starts showing bullish divergence (price making lower lows while RSI makes higher lows).
Sentiment Rating

Thank you for reading! If you have any questions, comments, or feedback leave a comment below.
Nothing written, expressed, or implied here should be looked at as investment advice or an admonition to buy, sell, or trade any security or financial instrument. As always, do your own diligence.