


JasmyCoin (JASMYUSDT) Analysis
JasmyCoin (JASMYUSDT) : A Technical Breakdown and Price Analysis | February 14, 2025

Level up your crypto trading with 35 years of combined market expertise. Eli R. Brown Crypto Research now features veteran market analyst Bruce Powers (CMT). Expect weekly trade signals (entries, stops, targets) for top crypto pairs and trending coins. Plus, get ready for Discord access, algorithmic strategies, and video calls.
Please note that all cryptocurrency charts use the Binance price feed for consistency, unless otherwise specified.
This information is for educational purposes only. Nothing written, expressed, or implied here should be looked at as investment advice or an admonition to buy, sell, or trade any security or financial instrument. As always, do your own diligence.
JasmyCoin (JASMYUSDT)
Weekly Chart

Key Points
Completed $0.0563 or 1,948% advance from the August 2023 low at $0.0027 in early-December of 2024. Subsequent bearish correction found support last week at the AVWAP level derived from the 2023 bottom. Notice it also marked an area of support at the August minor swing low and the October swing lows.
Trendline support was broken last week before support was seen around the AVWAP level. Then again this week as well, much of the trading activity has occurred below the uptrend line. Staying below the uptrend line is a sign of weakening. However, that could change.
Resistance this week was seen around the 20-week moving average (orange), now at $0.0253. It’s interesting to note that last week’s high of $0.0274 found resistance around the 20-day moving average (purple).
Overall, the weekly chart shows weakening but the bullish trend structure of higher swing highs and higher lows has been retained. That might start to change if last week’s low of $0.0186 is tested. A drop below last week’s low will also put JASMYUSDT below the AVWAP.
Nonetheless, support may continue to hold, leading to a bullish advance. This week’s low at $0.0210 is key near term weekly support.
The analysis provided below looks at a possible bullish setup on the lower time frame.
Trade ideas are suggestions and readers should use their own analysis and risk parameters and make adjustments accordingly.
Daily Chart

Key Points
Closer view seen on daily chart. Notice falling parallel trend channel and how the recent low hit the lower line of the channel. Further, notice the relationship with the 200-day moving average (blue), now at $0.0255. The 20-day recently fell back below the 200-Day line and is currently at $0.0247.
Potential bullish setup is shown on the 4-hour chart below.
4-Hour Chart
Key Points
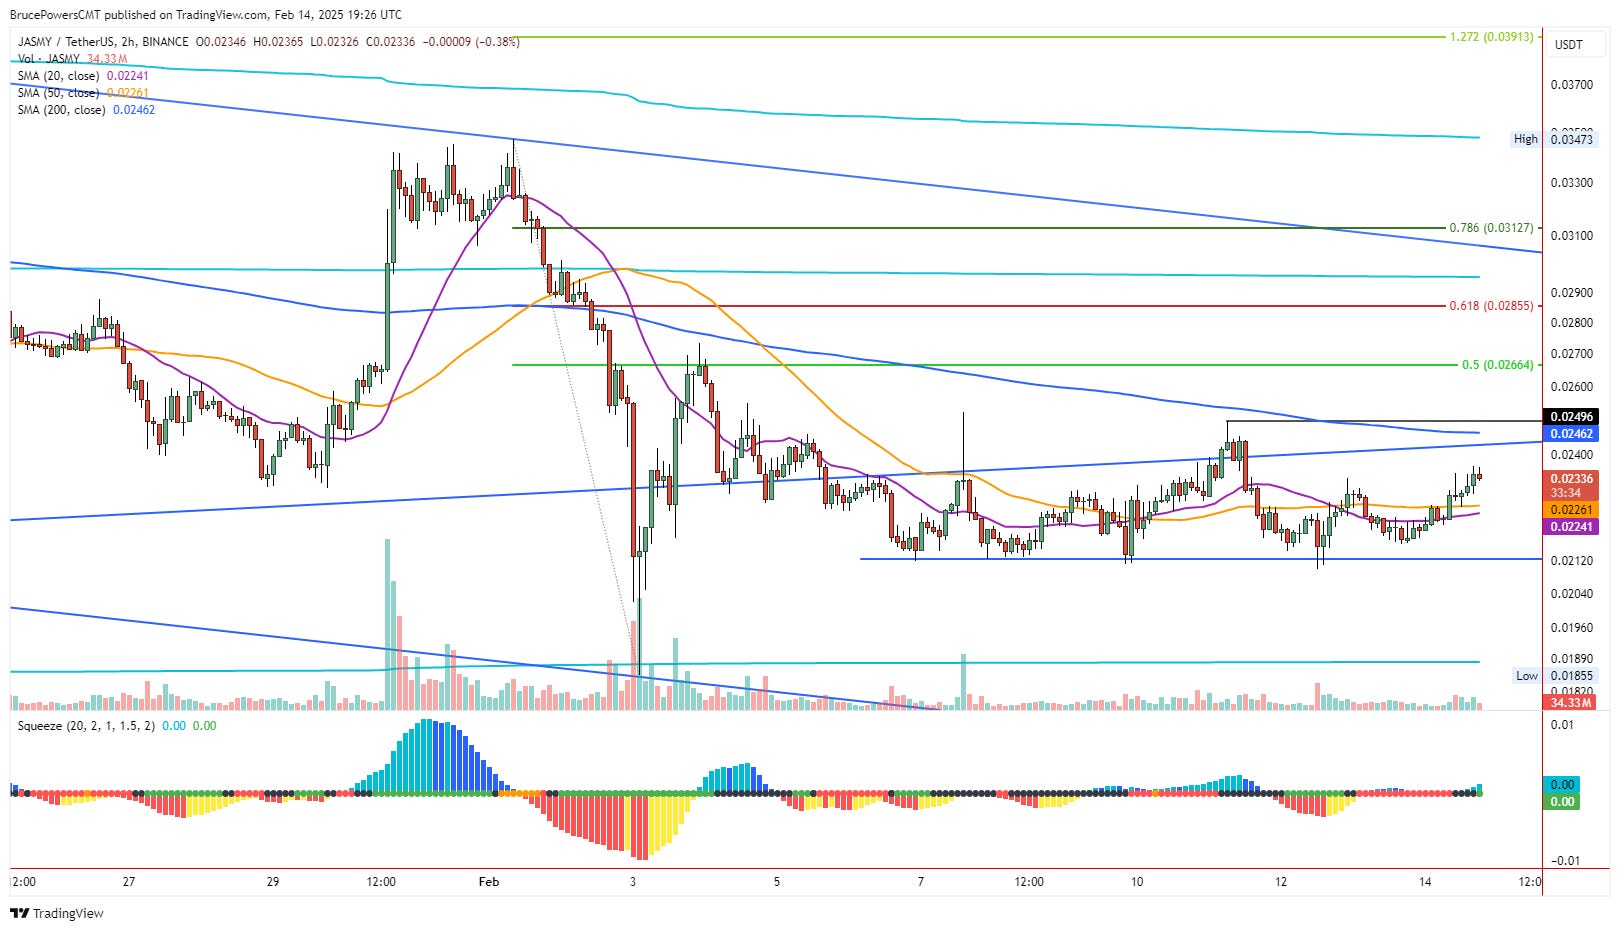
JASMYUSDT has been consolidating over the past week or so as volatility declines and price compresses. The convergence of the 50-day and 20-day moving averages recently is another way to identify low volatility.
What comes after very low volatility is an increase in volatility or the potential for trending.
Lower window shows the TTM Squeeze indicator. It is designed to help identify areas of very low volatility as it can lead to price expansion. Currently, it is alerting to the potential for price expansion out of recent consolidation. As with all indicators, it doesn’t always work however when combined with other analysis it can be a powerful tool.
Since support was seen recently at the long-term AVWAP level and JASMYUSDT is in an uptrend, the expectation is for a rally. If it doesn’t trigger, there is no trade.
Trade Idea - 4-Hour Chart - LONG
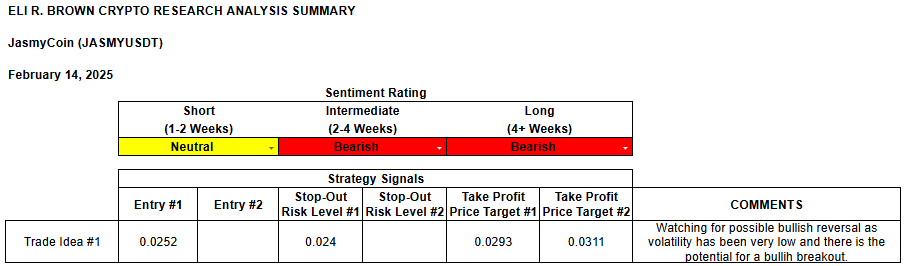
Enter LONG on breakout above interim swing high at $0.0250 ($0.0252). A reclaim of the 200-period moving average on 4-hour chart, now at $0.0246, should also have occurred by then.
If stopped out, look for another entry long if the overall criteria remains similar.
Stop Loss Level:
Full Stop: $0.0240 (below 200-period moving average and uptrend line)
Trailing Stop. Once in profits and approaching the initial target, use a trailing stop.
Take-Profit Targets:
Take-Profit Target 1 (TP1): $0.0293
Targets AVWAP potential resistance starting from the June 2024 peak.
Reward: $0.0041
R:R: 3.4
Take-Profit Target 2 (TP2): $0.0311
Targets 78.6% retracement at $0.0313.
Reward: $0.0059
R:R: 4.9
Sentiment Rating & Signals
Thank you for reading! If you have any questions, comments, or feedback leave a comment below.
This information is for educational purposes only. Nothing written, expressed, or implied here should be looked at as investment advice or an admonition to buy, sell, or trade any security or financial instrument. As always, do your own diligence.