


Binance Coin Analysis
October 9, 2024 | Weekly Update | Eli R. Brown Crypto Research

Onto our Binance Coin analysis.
Check out the Ethereum Analysis we published last night:
Check out the Bitcoin Analysis we published yesterday evening:
Sign up for a risk-free 14-day trial to Eli R. Brown Crypto Signals:
NOTE: All of the cryptocurrencies I analyze trade on the Binance Exchange.
Weekly Chart

BNBUSDT price closely follows BTCUSDT. The blue line is the 50-Week simple moving average and it has held as support so far.
Weekly Chart
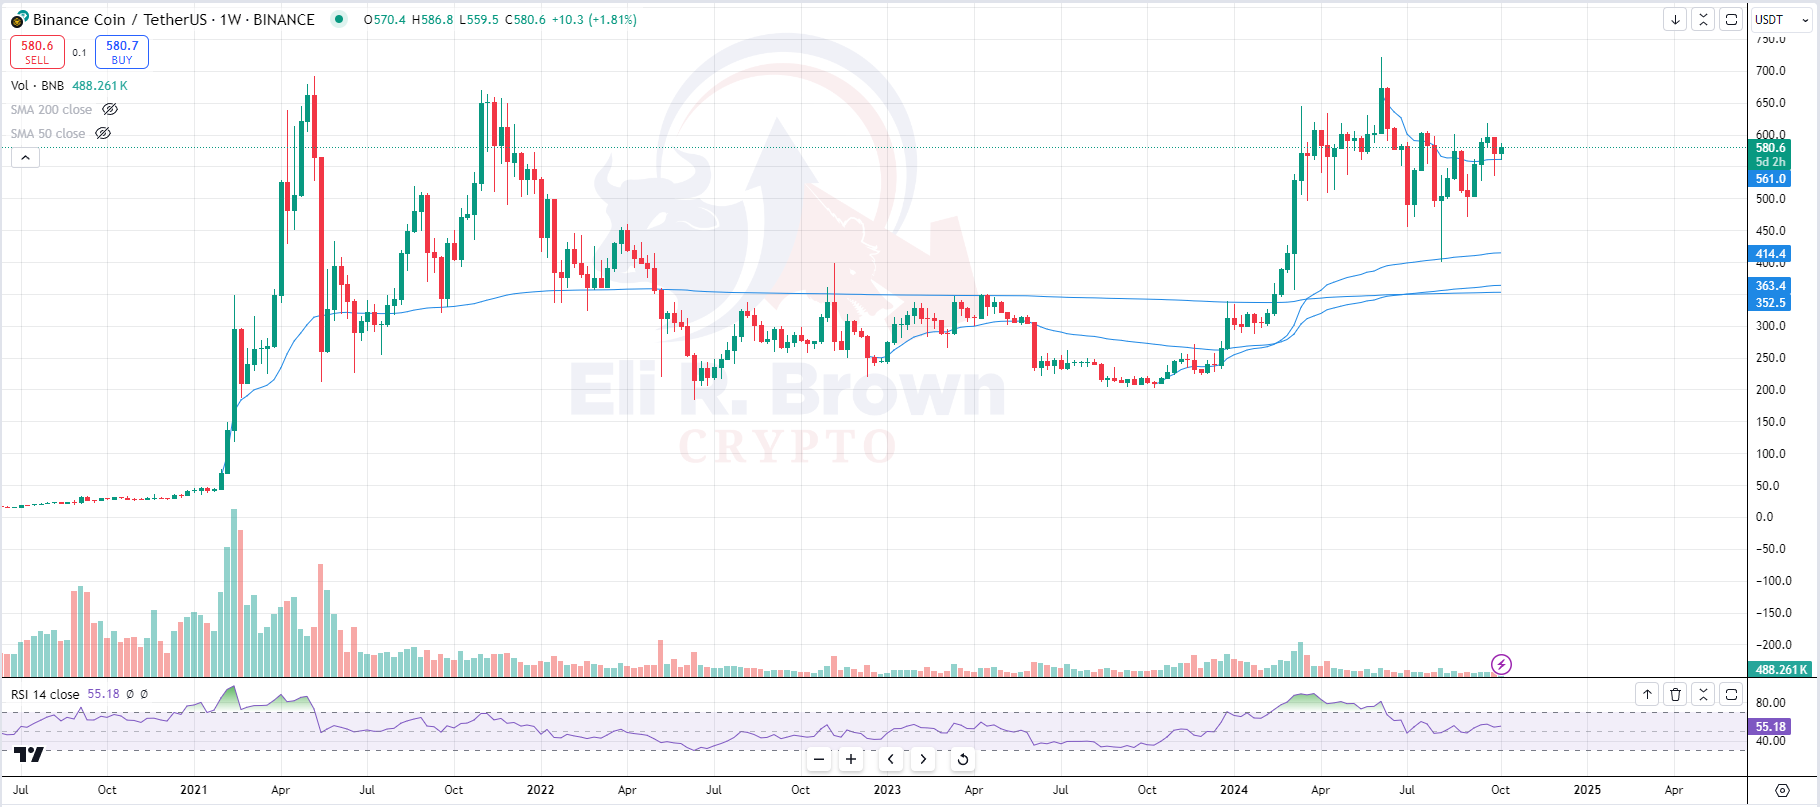
We’re trending above all major Anchored VWAPs including the 2021 breakout, Oct 2022 and Oct 2023 support pullbacks, and the YTD High.
Price is still consolidating below its previous All Time Highs (ATH) around $650 from November of 2022 and April of 2021 telling me we have a major resistance zone around $600-$650.
Daily Chart
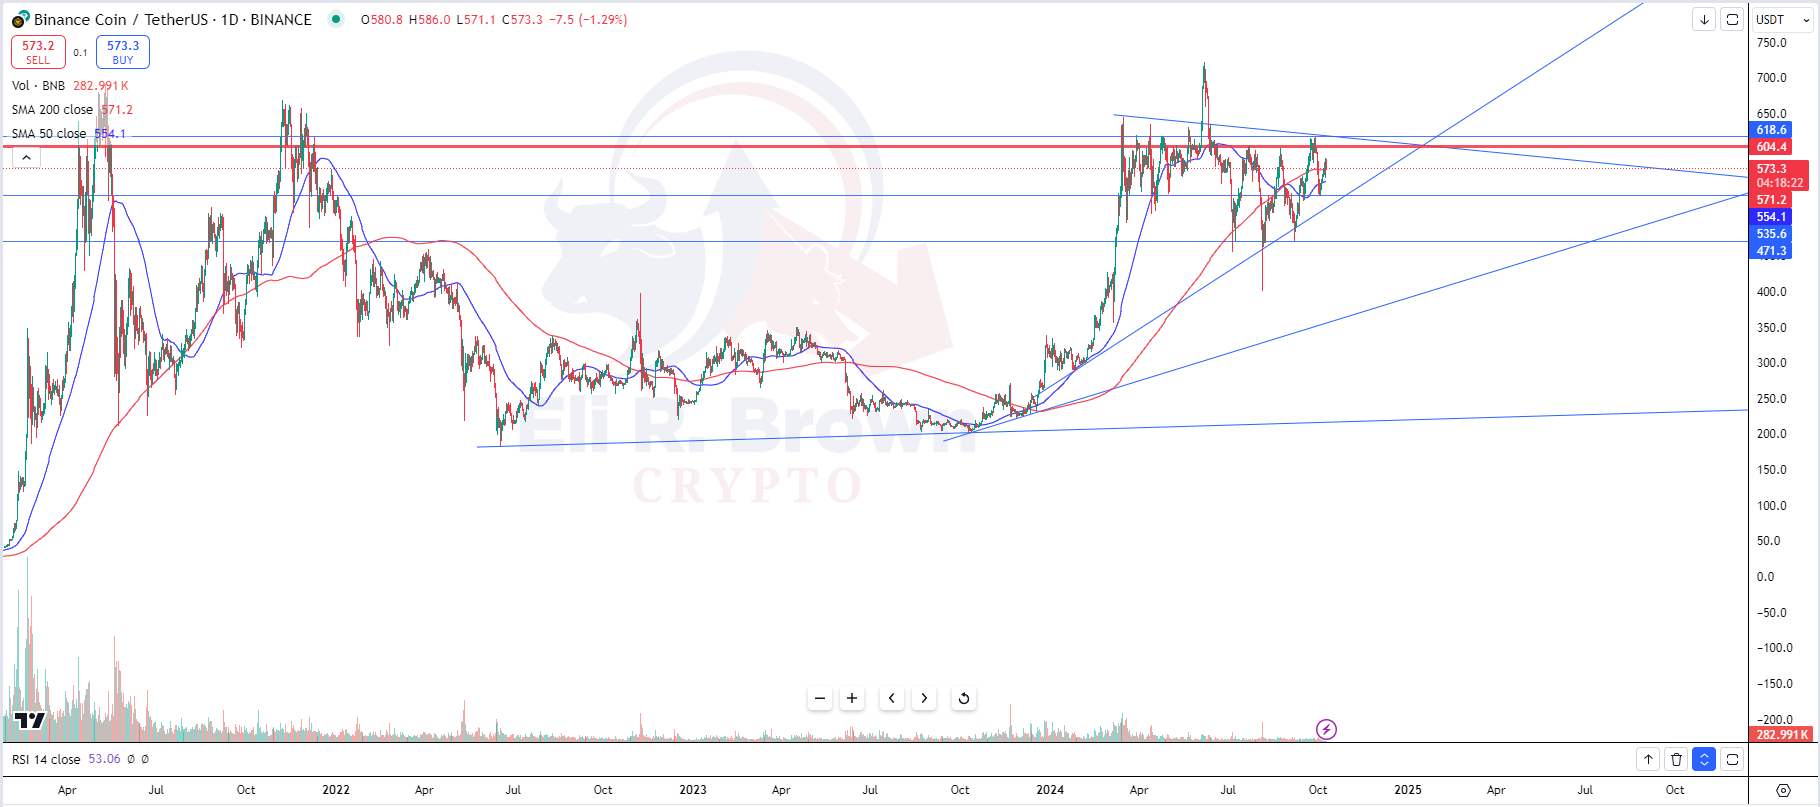
For me to flip bullish we need to begin putting in higher lows above $604-$618 resistance zone.
Hard line in the sand is $604.40
Our two major support levels sit at $535.60 and $471.30. Sustained lower highs below these levels and I would look for a short towards the trendline support sitting around $400.
Daily Chart
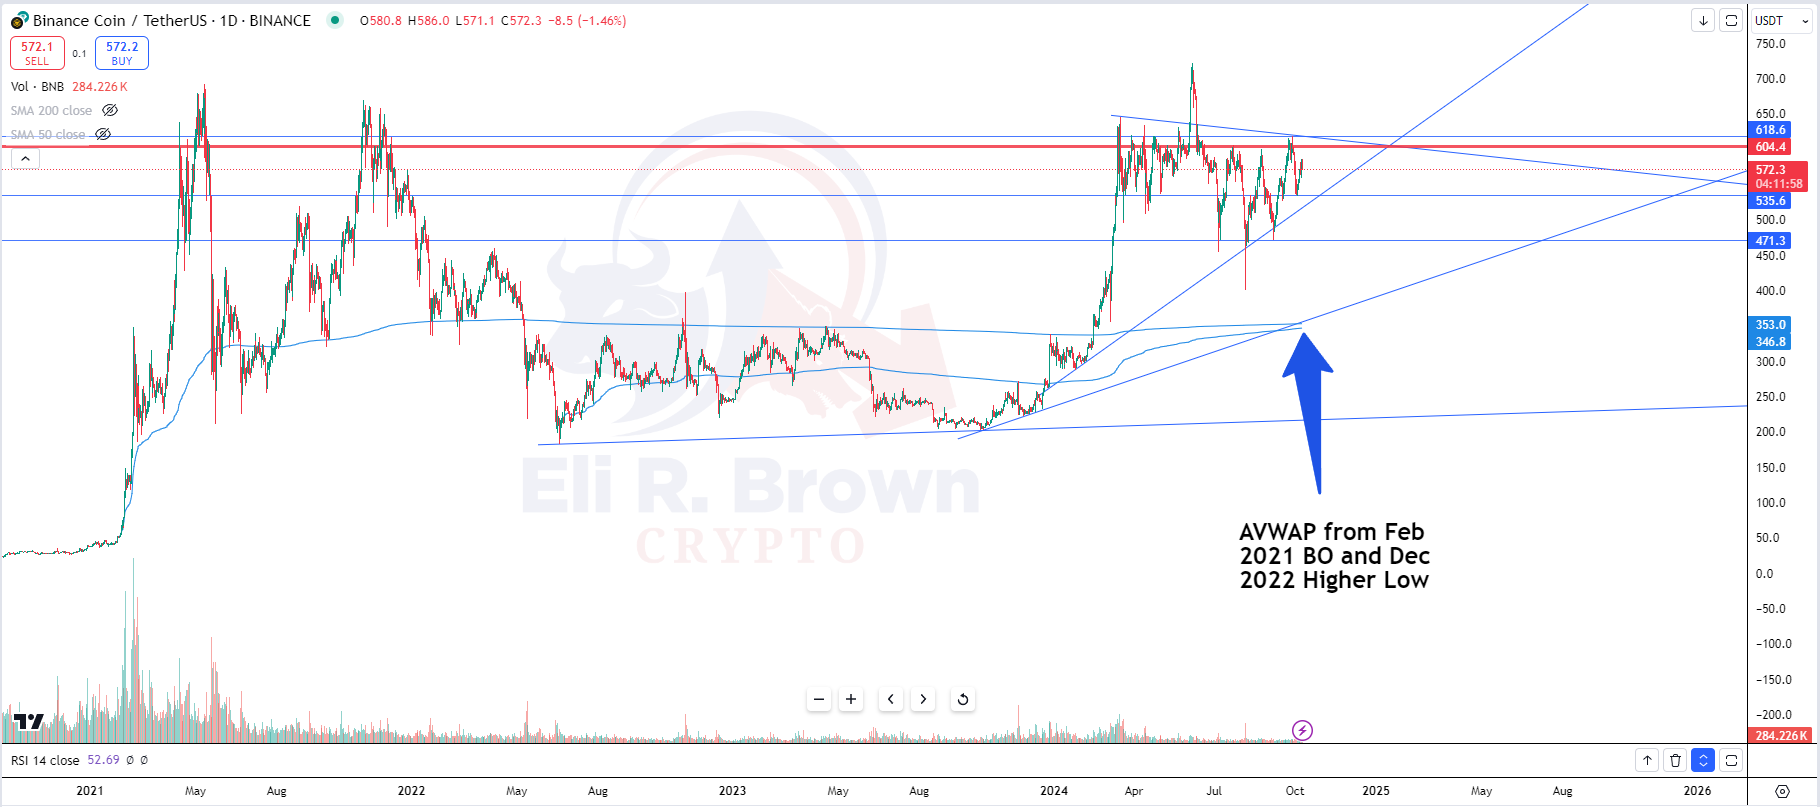
Anchored VWAP from the February 2021 breakout and the December 2022 higher low pullback both sit around $350. If we break support levels this would serve as an ideal bounce trade zone once price begins to put in higher lows giving us a defined risk level.
Sentiment Rating
Thank you for reading! If you have any questions, comments, or feedback leave a comment below.
Nothing written, expressed, or implied here should be looked at as investment advice or an admonition to buy, sell, or trade any security or financial instrument. As always, do your own diligence.