

Onto our Ethereum analysis.
Check out the Bitcoin Analysis we published a few hours ago:
Sign up for a risk-free 14-day trial to Eli R. Brown Crypto Signals:
NOTE: All of the cryptocurrencies I analyze trade on the Binance Exchange.
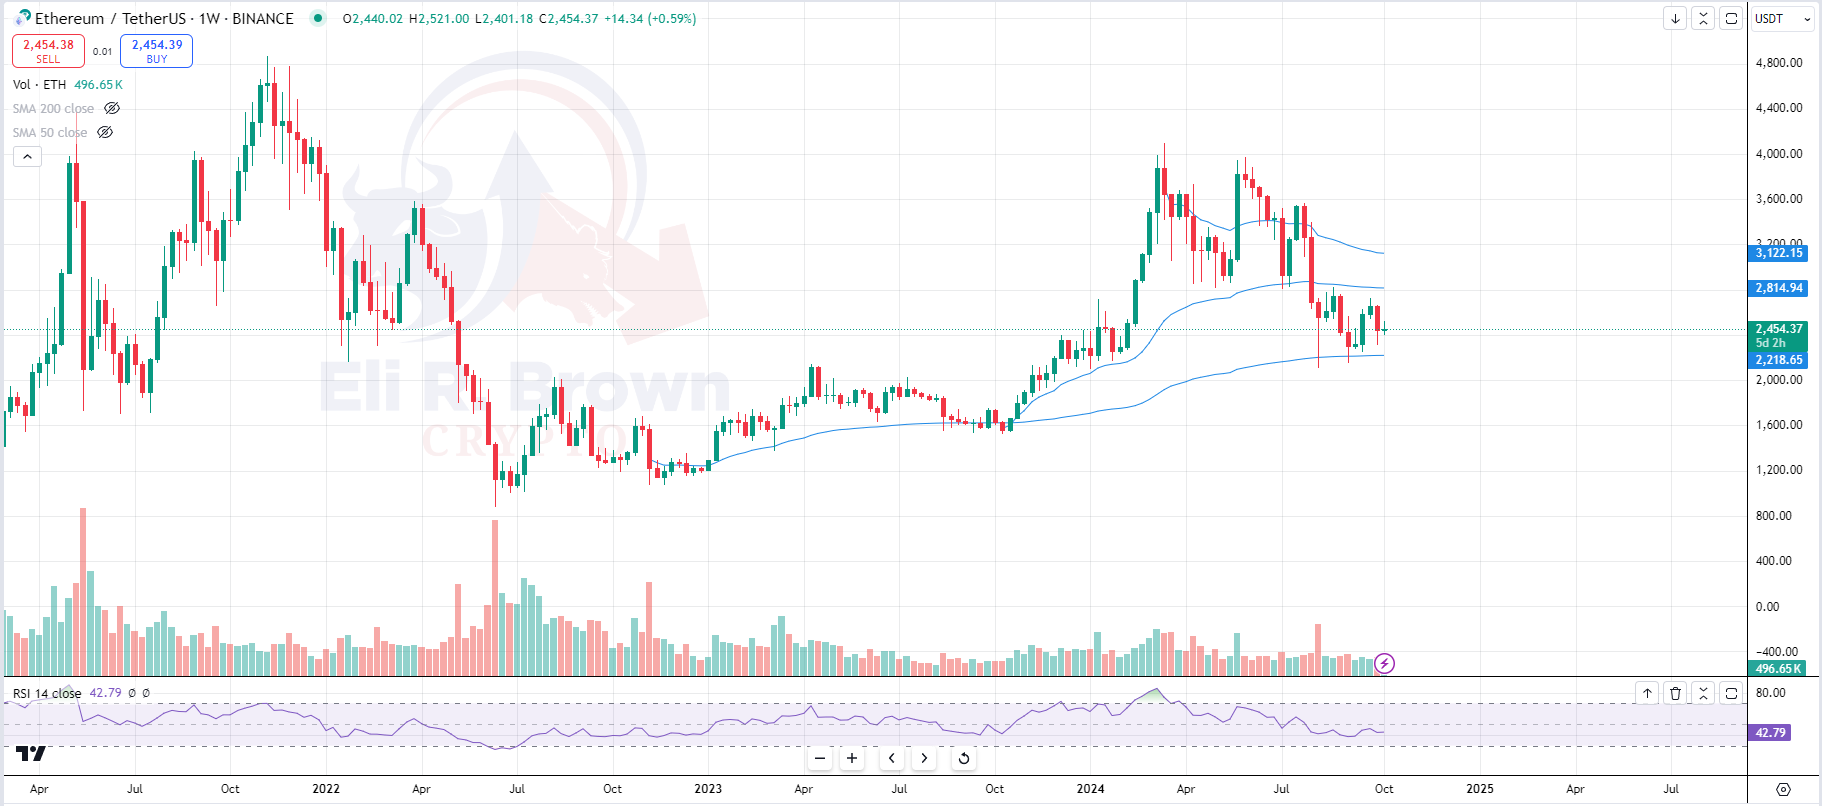
Weekly Chart

Note the difference in range between the price of ETH and it’s 50 and 200 week moving averages and the difference in range of BTC’s price and it’s moving averages (Click here to view BTC Weekly Chart). BTC is displaying relative strength compared to ETH.
The 200-Week SMA is acting as support which coincides with it’s previous resistance zone of $2K. Price has a history of dipping slightly below the 200-Week SMA.
Volume seems to have tapered off during this consolidation phase, indicating that a potential larger move (breakout or breakdown) may be building due to lower participation. A volume surge on either side of the 200-week SMA or 50-week SMA could give clues about future direction.
Weekly Chart
Anchored VWAPs provide insight into the average price paid by participants during the specific point in time they’re anchored from.
ETH is below the Oct 2023 and the YTD High VWAP levels, suggesting the average buyers during these timeframes are in losing positions.
However, price is still above the AVWAP from November 2022, telling me traders who position earlier are still green and may continue to support the price.
Daily Chart
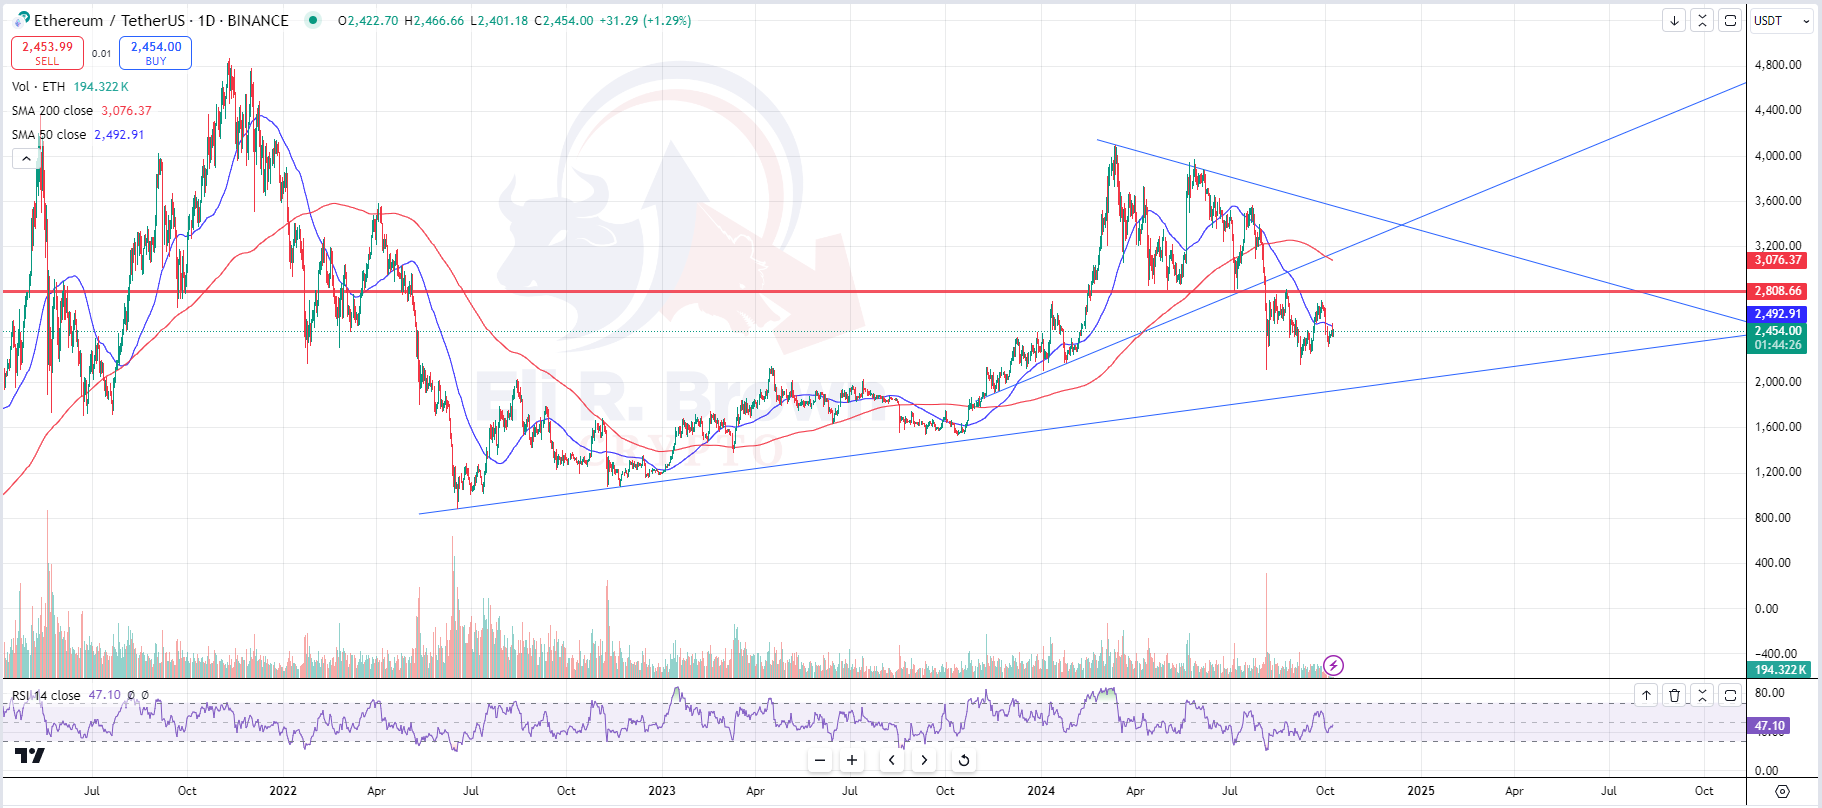
Trend analysis widens our range with overhead intersection resistance around $3,400 and support around $2,000.
The line in the sand for me is $2,800 to begin looking for higher lows to get long. Keeping in mind the resistance levels between $3,000 and $3,400 and to position size accordingly.
Daily Chart

As I noted this AVWAP level from March 10, 2023 on the BTC Analysis (VIEW HERE) I also noted it here. Interestingly, it appears traders since this time are the ones likely supporting the price at these levels.
Daily Chart

If we begin to put lower highs below $2,111.00 I would began looking for a short position otherwise I am looking for a long over $2,808.66 with sustained higher lows and staying mindful of resistances levels over $3K.
I still believe ETH will follow BTC’s price action closely however its relative performance will likely continue to stagger until we see increased relative volume & momentum.
Sentiment Rating

Thank you for reading! If you have any questions, comments, or feedback leave a comment below.
Nothing written, expressed, or implied here should be looked at as investment advice or an admonition to buy, sell, or trade any security or financial instrument. As always, do your own diligence.